8. Renesas Realtime Performance Monitor View
Feature Summary
The Real-Time Performance Monitor (RPM) allows users to monitor and analyse the performance of the processor and the system when debugging bare-metal with an E2 Emulator.
By using the RPM view, users can easily collect essential information during the debugging process, including:
PMU (Performance Monitoring Unit) Monitor: Accesses hardware event counters on the target processor to measure metrics, including:
Instruction cycles: Counts all retired instructions, including those failing condition checks, it helps evaluate instruction throughput and detect performance bottlenecks.
Exceptions: Counts each exception taken, it supports identifying abnormal runtime behaviour and improving system reliability.
Memory accesses: Counts load/store memory operations, it is useful for analysing memory traffic and detecting performance hotspots.
Cache hit ratios: Derived from L1/L2 instruction cache access and refill events, it indicates instruction fetch efficiency and guides cache/memory optimisation.
RAM and IO Monitor: Enables observation of memory and register values in real time. Captured data can be directly visualised or applied to arithmetic equations for further analysis.
The RPM view provides two display modes:
Normal mode: Data is stored in the emulator’s RAM and displayed after recording is complete.
Real-time mode: Data is continuously streamed directly to the PC via USB and displayed in real time during program execution. This mode is suitable for live performance monitoring.
In addition, the RPM view supports equation-based analysis, allowing users to perform calculations on RAM/IO monitored data using custom formulas through the Equation chart.
8.1. Supported Environments
Operating System |
Windows: Windows 10 / Windows 11 Linux: Ubuntu 22.04 / Ubuntu 24.04 |
VS Code version |
1.102.0 (minimum) |
Memory Capacity |
8 GB (minimum) |
8.2. Supported Target Devices
The RPM view supports the following Renesas devices:
R-Car S4: CA55/CR52
R-Car V4H: CA76/CR52
R-Car V4M: CA76/CR52
8.3. Configure the RPM view
This section introduces how to configure the settings in the RPM view before collecting and displaying data.
8.3.1. Configure the debug configuration
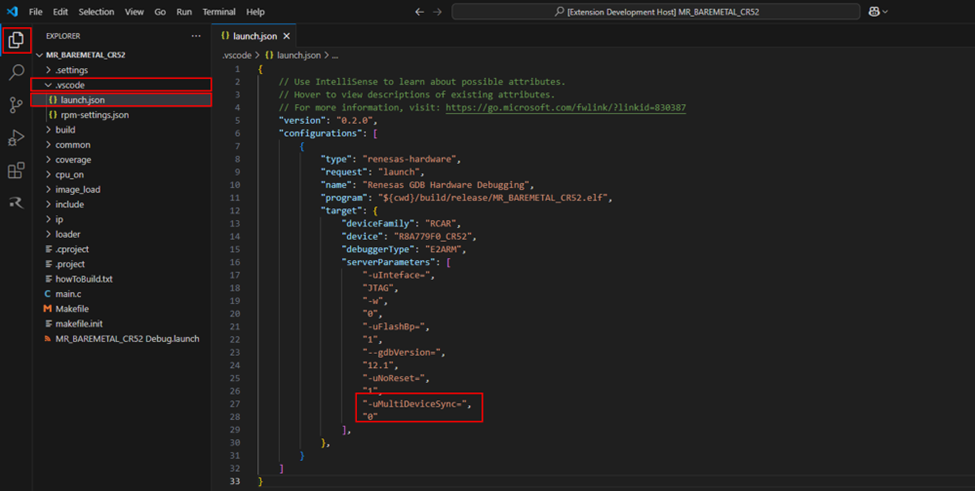
To use the RPM view during the debugging process, the user must disable the Multi-device Synchronous Debugging option. Follow the steps below to do it:
Step 1: Open the debug project.
Step 2: Navigate to Explorer > .vscode > launch.json
Step 3: Add argument “-uMultiDeviceSync=”, “0”
8.3.2. Enabling the RPM view
Follow the steps below to enable the RPM view during debugging:
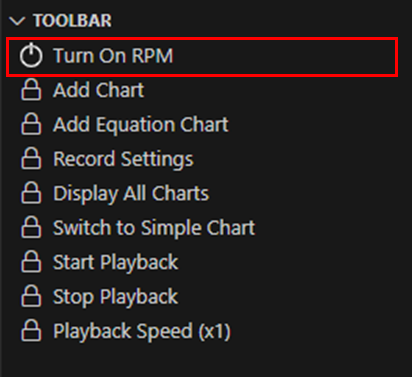
Step 1: Start Debugging the program first
Step 2: Click the Turn ON RPM button to activate RPM.
8.3.3. Add and configure the settings for each monitored object
To add and configure for each monitored object, follow these steps:
Step 1: In the RPM view, click the Add Chart button to open the Add Chart dialog.

Step 2: In the Add Chart dialog, enter the name and select the target core as follows:
Label: Enter a unique label. The name must start with a letter and contain only letters, numbers, or underscores.
Core: Click the drop-down arrow and select the target core.
Step 3: Select the monitor type for the object:
To monitor PMU events, use the following configuration:
Monitor Type: Select PMU Monitor.
Measurement Item: Select a Measurement.
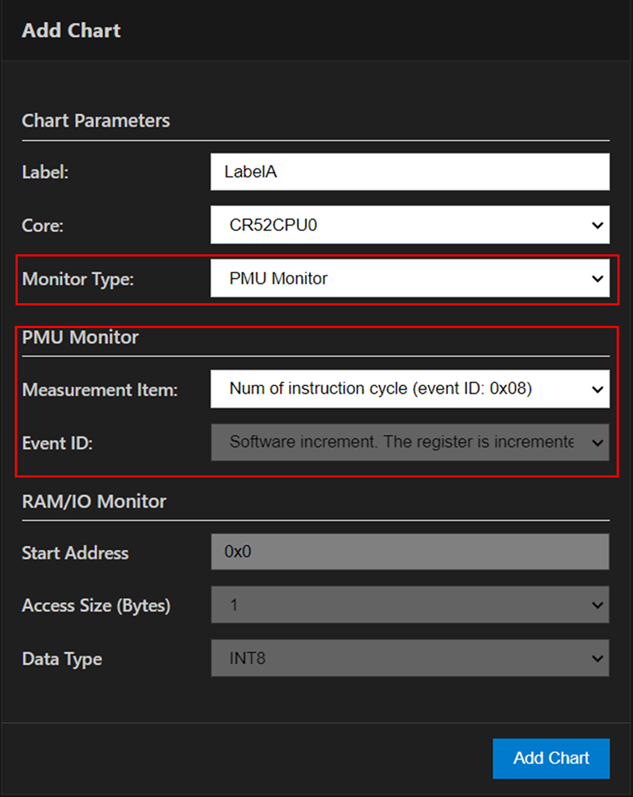
To monitor RAM/IO values, use the following configuration:
Monitor Type: Select RAM/IO Monitor.
RAM/IO Type: Select how to specify the target memory or register:
Start Address: Enter the address of memory and register.
Access Size: Select the access size of the memory and register.
Data Type: Select the type of data

Step 4: Click the Add Chart button to add the new chart to the RPM view.
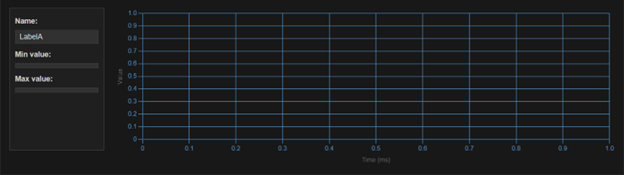
The newly added chart will appear with the following interface:
Note
The maximum limitation for all monitor types is 16 channels.
8.3.4. Add and configure the settings for equation chart
To calculate and combine data for a RAM/IO monitored object using Equation, follow these steps:
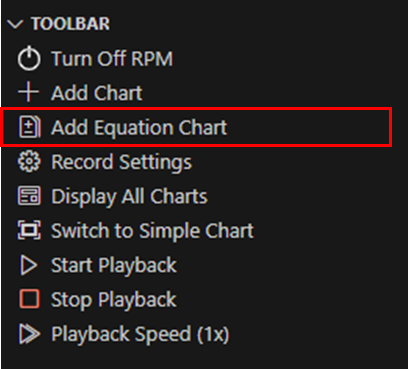
Step 1: Click the Add Equation Chart button in the RPM toolbar to open the Add Equation Chart dialog.
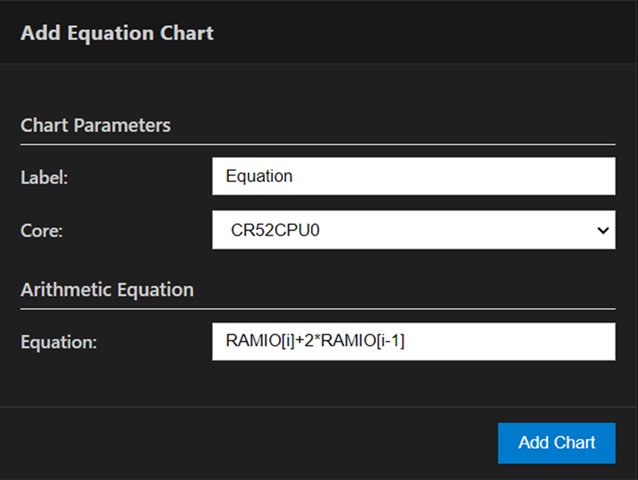
Step 2: In the Add Equation Chart dialog, enter as below:
Label: Enter a unique label. The name must start with a letter and contain only letters, numbers, or underscores.
Core: Click the drop-down arrow and select the target core.
Equation: Add calculation between charts measuring RAM/IO registers, add [i] for the current value and [i-1] for the previous value (e.g., RAMIO[i] +2*RAMIO[i-1]).
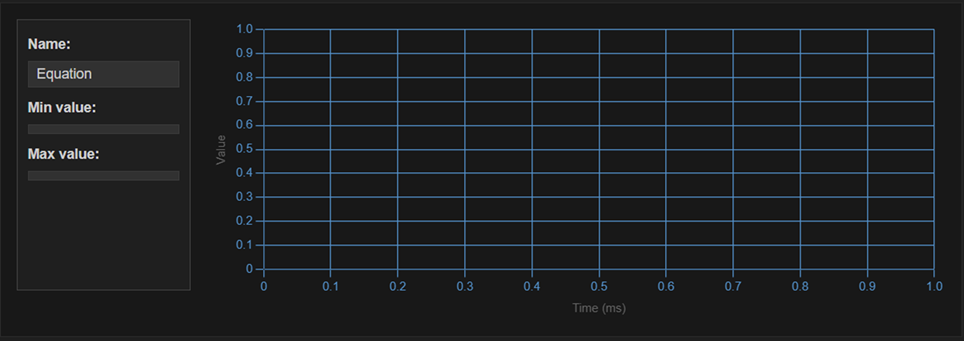
Step 3: Click the Add Chart button to add the new chart to the RPM view.
The newly added chart will appear with the following interface:
8.3.5. Configure the record mode
After adding and configuring each monitored object in the RPM view, set the display mode before using the RPM view. Follow the steps below:
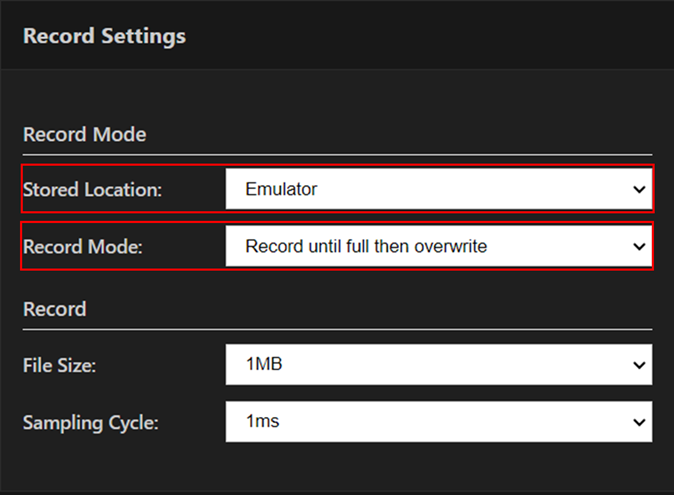
Step 1: Click the Record Settings button to open the Record Setting dialog:

Step 2: In the Record Setting dialog, set the display mode as below:
To use Normal mode:
Stored Location: Select Emulator.
Record Mode: Select one of the following options:
Record until full then stop: When the storage destination becomes full, RPM shall stop capturing data, preventing any overwriting.
Record until full then overwrite: When the recording destination becomes full, RPM shall continue recording, overwriting the previously recorded data.
To use Real-time mode:
Stored Location: Select PC,
Record Mode: Select Record until full then overwrite.

Step 3: Continue to set the general record settings for the display mode:
File Size: Select the desired value.
Sampling Cycle: Select the desired value.
Note
Settings in the dialog are automatically saved when adjusted by the user.
8.3.6. Configure rpm-settings.json
In addition to configuring the RPM view using the graphical dialog, users can also configure settings via command by editing the rpm-settings.json file. This file is automatically generated when the user activates the RPM view for the first time.
To configure rpm-settings.json, follow the steps below:
Step 1: From the menu bar, select Explorer >.vscode > rpm-settings.json
Step 2: To configure the data recording settings, update the renesasRPM.recordSettings section.
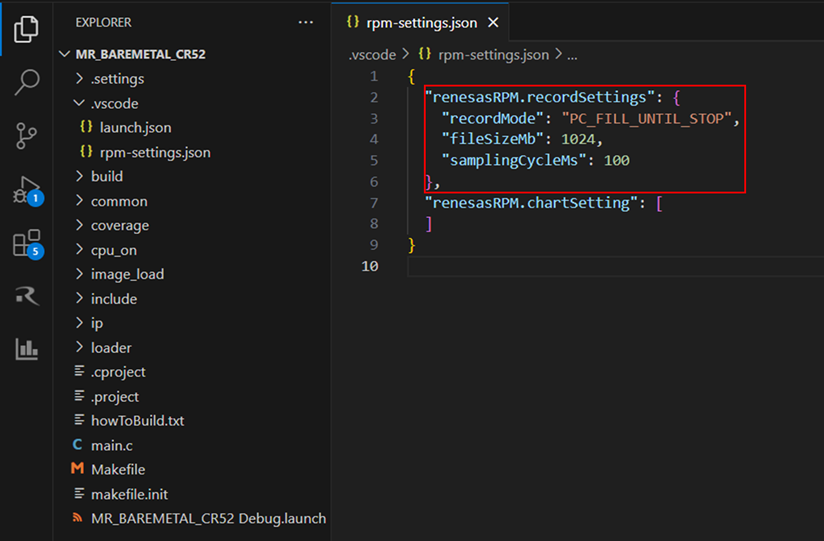
This table describes the available parameters in the renesasRPM.recordSettings section.
Item |
Value |
Note |
|---|---|---|
recordMode |
PC_FILL_UNTIL_FULL |
Enables Real-Time Mode. Data is streamed to the PC until storage is full. |
E2_FILL_UNTIL_FULL |
Enables Normal Mode. Data is stored in the emulator and recording stops when the E2 emulator’s RAM is full. |
|
E2_FILL_UNTIL_STOP |
Enables Normal Mode. Data is stored in the emulator and old data is overwritten when the E2 emulator’s RAM is full. |
|
fileSizeMb |
512, 1024, 1536, 2048, 2560, 3072, 3584, 4096 |
Sets the file size (in MB) for Real-Time Mode. |
1-8 |
Sets the file size (in MB) for Normal Mode. |
|
samplingCycleMs |
1, 10; 100; 1000 |
Sets the data sampling interval (in milliseconds) for both modes. |
To add new charts, update the renesasRPM.chartSetting section.
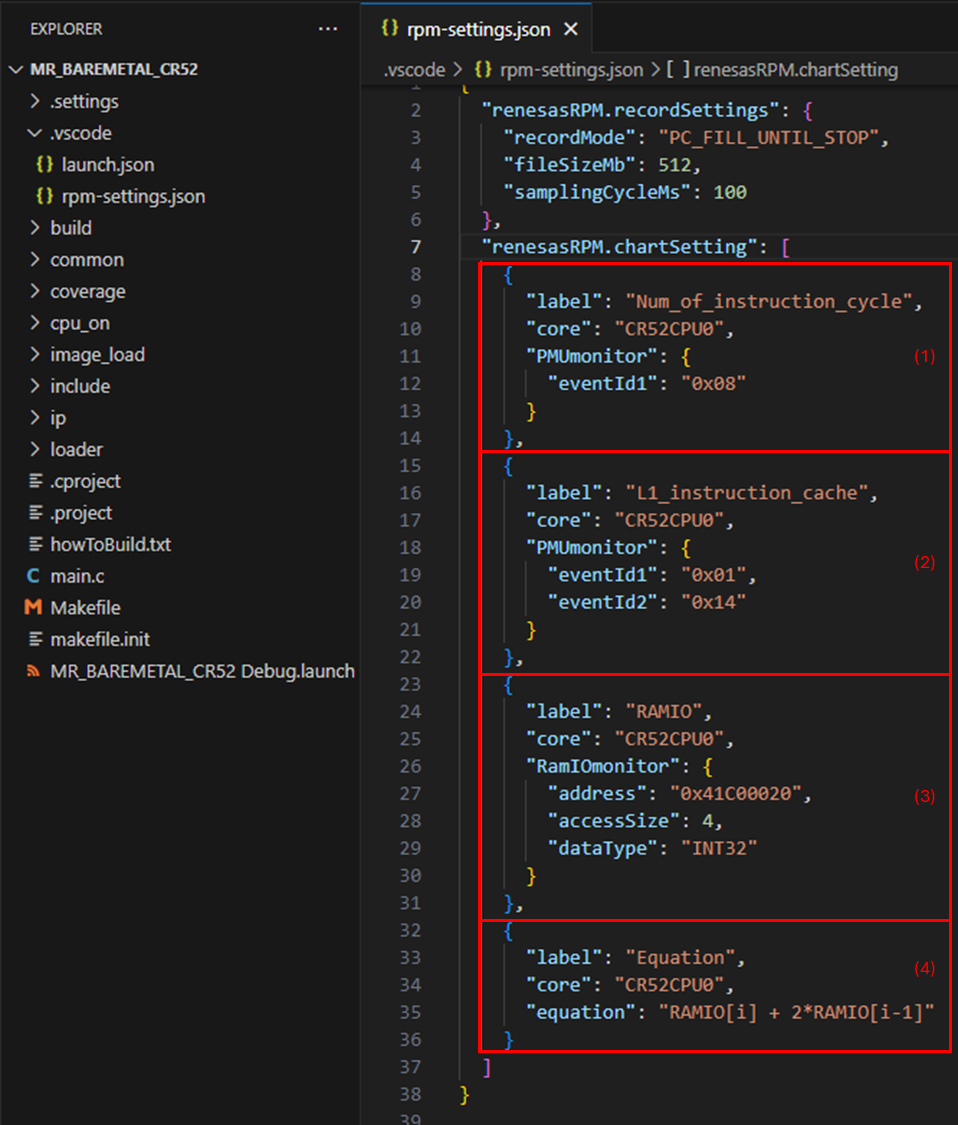
This table describes the available parameters in the renesasRPM.chartSetting section.
Chart type |
Items |
Value |
Feature |
|---|---|---|---|
Common Items (apply to all chart types) |
label |
string |
Sets a unique name for the chart. |
core |
core ID |
Specifies the processor core to monitor. |
|
|
eventId1 |
PMU event ID |
Monitors a single hardware event (e.g. instruction cycles and exceptions). |
|
eventId1 |
refill count event ID |
Specifies the refill count event IDs used for the Cache Hit Ratio calculation. |
eventId2 |
access count event ID |
Specifies the access count event IDs used for the Cache Hit Ratio calculation |
|
|
address |
memory address |
Specifies the memory or register address to monitor. |
accessByte |
1, 2, 4, 8 |
Sets the access size in bytes. |
|
dataType |
INT8, UINT8, INT16, UINT16, INT32, UINT32,FLOAT32, INT64,UINT64, FLOAT64 |
Set the type of data |
|
|
equation |
expression (e.g.
|
Performs calculations between RAM/IO charts using current and previous values. |
This table is used to describe the information of supported event IDs for Cache Hit Ratio Calculation.
Target Cache for Hit Ratio Monitoring |
Refill count event ID |
Access count event ID |
|---|---|---|
L1 instruction cache |
0x01 |
0x14 |
L1 data cache |
0x03 |
0x04 |
L1 instruction TLB (Translation Lookaside Buffer) cache |
0x02 |
0x26 |
L1 data TLB cache |
0x05 |
0x25 |
L2 data cache |
0x16 |
0x17 |
Step 4: Save rpm-settings.json file to apply setting.
8.4. Operate the RPM view
This section introduces how to operate the RPM view.
8.4.1. Collect and display data in the RPM view
This chapter describes how to collect and display data in the RPM view.
After the settings are configured in the RPM view, the view automatically collects and displays data either during or after program execution, depending on the selected display mode:
Normal mode: Start recording by clicking the Continue button. Data is displayed only after recording stops. Click Pause to stop recording and review the captured waveform data.
Real-time mode: Start recording by clicking the Continue button. Data is continuously streamed and updated in real time on the chart view. Click Pause to stop recording.
8.4.2. Analyse the data in the RPM view (detailed view)
By default, the RPM view displays data in the detailed view mode.
In the detailed view, the user can see the detailed information of each monitored object:
Chart Information Panel:
Displays essential details of each chart (name, time scale, vertical range).
Provides options to synchronise or adjust the display.
Allows users to configure the vertical range manually or use auto-scaling for dynamic adjustment.
Vertical Ruler: Shows the scale for data values.
Horizontal Ruler: Represents the timeline of collected samples.
Chart Data Area:
Displays actual data as a waveform over time.
Enables analysis of variations in data.
Supports zoom in/out functionality.
Allows users to observe changes in detail.

8.4.3. Analyse the data in the RPM view (simple view)
The RPM view also supports a simple view mode, which hides detailed information to allow more charts to be displayed simultaneously. This mode is useful for overview analysis.
Click Switch to Simple View button in the RPM toolbar to turn on/turn off the simple view mode.

In the simple view, detailed information for each monitored object is hidden. Instead, only key information is displayed:

In the simple view, users can still monitor the waveform of each chart along with its basic indicators such as chart name, and data trends. While advanced configuration options are hidden, the simplified layout allows users to quickly compare multiple charts at once, identify patterns, and observe overall performance changes across monitored objects.
8.4.4. Playback mode feature
In addition to displaying data in Real-Time Mode and Normal Mode, RPM also supports Playback Mode, which allows users to play back collected data in waveform format at a specified speed.
To use this feature, following these steps:
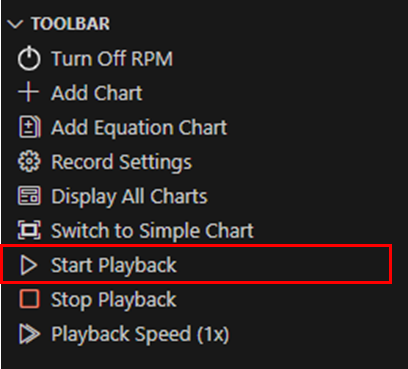
Step 1: Users must collect data using either Real-Time Mode or Normal Mode before playback can be used.
Step 2: Once data is available, click the Start Playback button on the toolbar to begin playback.
Step 3: To temporarily pause playback, click the Pause Playback button.

Step 4: To adjust the playback speed, click the Playback Speed button and select the desired speed.

Note
Speed changes can only be made when playback is not running.
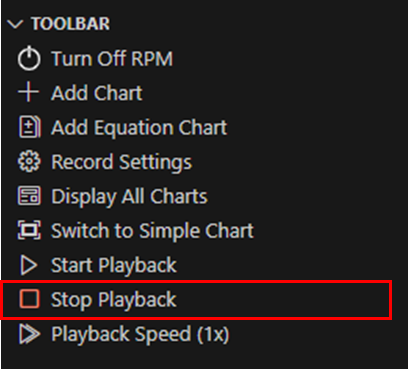
Step 5: To completely stop playback and display all data, click the Stop Playback button.
8.5. List the Limitations
8.5.1. Display Limitations and Performance Recommendations
Displaying an excessive amount of data within the application can lead to significant user interface lag or even cause the program to freeze. When this occurs, interactions with the software may become extremely slow or entirely unresponsive, potentially requiring a restart of the application. Such interruptions can disrupt the user’s workflow and productivity.
To help avoid these issues, consider the following best practices:
Limit the number of charts displayed at any given time to reduce the processing load. Expected with 8 channels “Add Chart”.
Increase the sampling cycle to decrease the frequency of data updates, which can help manage the volume of data being processed and displayed. Expected with 10/100/1000 “samplingCycleMs”.
Close any other resource-intensive applications running simultaneously to free up system resources for optimal performance.