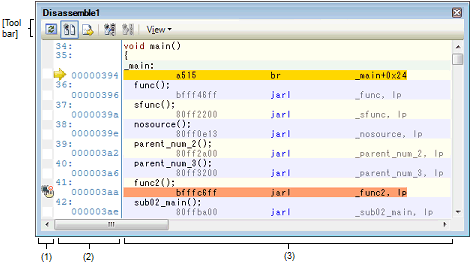
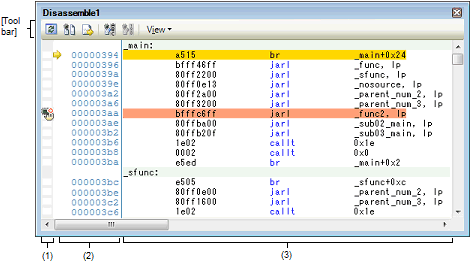
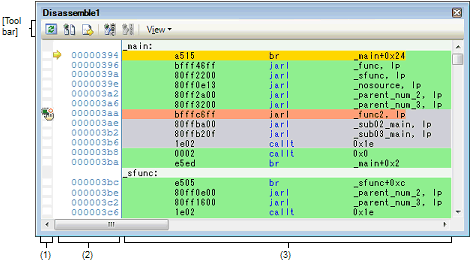
This panel is used to display the results of disassembling the contents of the memory (disassembled text), and execute line assembly (see "2.6.4 Perform line assembly").
Furthermore, the instruction level debugging (see "2.8.3 Execute programs in steps") and the code coverage measurement result display [Simulator] (see "2.15 Measure Coverage [Simulator]") can be performed in this panel.
Up to a maximum of four of these panels can be opened. Each panel is identified by the names "Disassemble1", "Disassemble2", "Disassemble3" and "Disassemble4" on the titlebar.
The source text in the source file corresponding to the code data can also be displayed by setting to the Mixed display mode (default).
This panel appears only when connected to the debug tool.
A step execution is performed in instruction level units when the focus is in this panel (see "2.8.3 Execute programs in steps"). |
You can set the scroll range of the vertical scroll bar on this panel via the Scroll Range Settings dialog box which is opened by clicking the |
You can print the current screen image of this panel by selecting [Print...] from the [File] menu. |
This panel can be zoomed in and out by |


This section describes the following.
The lines for which events can be set are shown with the background color in white (this mean that events cannot be set for those lines whose background color in gray).
In addition, the Event mark corresponding to an event that has been currently set is displayed.
This area is provided with the following functions.
By clicking where you want to set a breakpoint with the mouse, the breakpoint can be set easily.
The breakpoint is set to the instruction at the start address of the clicked line.
Once the breakpoint is set, the Event mark is displayed at the line that is set. In addition, the detailed information about the set breakpoint is reflected in the Events panel.
When this operation is performed at a place where any one of the event marks is already being displayed, that event is deleted and the setting of breakpoints cannot be done.
Note that the setting of events can be done only for those lines where the background color is shown in white.
See "2.9.3 Stop the program at the arbitrary position (breakpoint)" for details on how to set the breakpoint.
Event status can be changed from the following menu displayed by right-clicking the event mark.
|
Changes the selected event state to a Valid state. Event occurs when the specified condition is met.
When the event mark ( |
|
|
Changes the selected event state to an Invalid state. Event does not occur when the specified condition is met.
When the event mark ( |
|
|
When the event mark ( |
|
|
Opens the Events panel to display the detailed information of the selected event. |
By hovering the mouse cursor over the Event mark, the name of the event, the detailed information for the event and the comments added to the event are pop-up displayed.
When multiple events have been set in the applicable place, information for each event, up to a maximum of three events, is listed and displayed.
The address per line to start disassembling is displayed (hexadecimal number notation fixing).
In addition, the current PC mark ( ) that corresponds to the current PC position (PC register value) is displayed.
The address width corresponds to the one in memory space of the specified microcontroller in the project.
For the source text line in the Mixed display mode, line numbers (xxx:) in the source file correspond to the start address are displayed.
The current PC mark changes from |
This area is provided with the following functions.
By hovering the mouse cursor over a address or line number, the following information is pop-up displayed.
<Load module name> is displayed only when multiple load modules have been downloaded to the debug tool. |
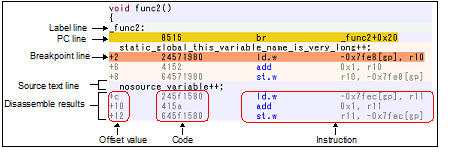
The results of disassembling are displayed next to the corresponding source text as follows:

The highlighting color depends on the configuration in the [General - Font and Color] category of the Option dialog box. |
The source text can be set to non-display by clicking the |
Offset values are not displayed by default. They can be displayed by clicking the |
This area is provided with the following functions.
Instructions and code displayed in this panel can be edited (line assembly).
See "2.6.4 Perform line assembly" for details on how to operate it.
Execution can be controlled at the instruction level unit by step executing a program in a state where there is a focus on this panel.
See "2.8.3 Execute programs in steps" for details on how to operate it.
Various events can be set to the addresses/lines where the caret currently exists by selecting [Break Settings], [Trace Settings], [Timer Settings] or [Performance Measurement Settings] from the context menu.
The corresponding Event mark is displayed in the Event area when an event is set. In addition, the detailed information about the set event is reflected in the Events panel.
Note, however, that the setting of events can be done only for those lines where the background color is shown in white in the event area.
See the following for details on how to set events.
A breakpoint can be set or deleted easily in the Event area as well (see "(a) Setting/deleting breakpoints"). |
Variable names of C language, CPU registers, I/O registers, and assembler symbols can be registered in the Watch panel as watch-expressions.
See "2.10.6.1 Register a watch-expression" for details on how to operate it.
By clicking the  button on the toolbar or selecting [Go to Symbol] from the context menu in a state where the caret has been moved to a instruction that has referenced a symbol, the caret position is moved to the address where the symbol at the caret position has been defined.
In addition, when following on this operation you click on the  button on the toolbar or select [Back to Address] from the context menu, the caret position is returned to the instruction that has referenced a symbol before the caret was moved (the address value of the instruction that has referenced a symbol is displayed in Address).
Selecting [Jump to Source] from the context menu will open the Editor panel with the caret moved to the source line corresponding to the address at the current caret position (if the Editor panel is already open, the screen will jump to the panel).
In addition, similarly, selecting [Jump to Memory] will open the Memory panel (Memory1) with the caret moved to the memory value corresponding to the address at the current caret position (if the Memory panel (Memory1) is already open, the screen will jump to the panel).
When the coverage function is valid, lines corresponding to the specified coverage measurement area are shown highlighted based on the code coverage measurement result that is acquired by executing the program.
See "2.15 Measure Coverage [Simulator]" for details on the coverage measurement.
The Data Save dialog box can be opened by selecting the [File] menu >> [Save Disassemble Data As…], and the contents of this panel can be saved in a text file (*.txt) or CSV file (*.csv).
See "2.6.2.5 Save the disassembled text contents" for details on the method for saving the contents of disassembled data.
|
Acquires the latest data from the debug tool, and updates the contents of this panel. |
||
|
Toggles between the mixed display mode (default) and disassemble display mode, as the display mode of this panel (see "2.6.2.1 Change display mode"). |
||
|
Specifies the caret position so that it follows the current PC value. |
||
|
Moves the caret to the define position of the selected symbol. |
||
|
Moves the caret to the position (address) immediately before it is moved with the |
||
|
The following buttons to set the display contents in the disassemble area are displayed. |
||
|
Displays the offset value of the label. The offset value from the nearest label is displayed when a label is defined for the address. |
||
|
Displays the address value in the format "symbol + offset value" (default). Note that when a symbol has been defined as the address value, only the symbol is displayed. |
||
|
Displays the name of the register by its function name (default). |
||
|
Opens the Scroll Range Settings dialog box to set the scroll range for this panel. |
||
[[File] menu (Disassemble panel-dedicated items)]
The following items are exclusive for the [File] menu in the Disassemble panel (other items are common to all the panels).
Note that all these items are disabled during execution of a program.
|
Overwrites the contents of the disassembling to the previously saved text file (*.txt)/CSV file (*.csv) (see "(h) Saving the contents of disassembled data"). Note that when the file has never been saved or the file is write disabled, the same operation is applied as the selection in [Save Disassemble Data As…]. |
|
|
Opens the Data Save dialog box to newly save the contents of the disassembling to the specified text file (*.text)/CSV file (*.csv) (see "(h) Saving the contents of disassembled data"). |
|
|
Opens the Print Address Range Settings dialog box for printing the contents of this panel. |
[[Edit] menu (Disassemble panel-dedicated items)]
The following items are exclusive for the [Edit] menu in the Disassemble panel (all other items are disabled).
|
When a line is selected, copies the contents of the selected line to the clipboard as a character string. In the case of the edit mode, copies the selected character string to the clipboard. |
|
|
Changes to the edit mode to edit the instruction/code at the caret position (see "2.6.4 Perform line assembly"). |
|
|
Opens the Find and Replace dialog box with selecting the [Find in Files] tab. |
|
|
Opens the Find and Replace dialog box with selecting the [Replace in Files] tab. |
|
|
Opens the Go to the Location dialog box to move the caret to the specified address. |
(1) Disassemble area and Address area
(2) Event area [Full-spec emulator][E1][E20]
|
Registers the selected character string or the word at the caret position to the Watch panel (Watch1) as a watch-expression (the judgment of the word depends on current build tool). At this time, since it is registered as a variable name, the symbol name that is displayed changes depending on the scope. |
|||
|
Opens the Action Events dialog box to set an action event to the address at the caret position. |
|||
|
Executes the program from the address indicated by the current PC value to the address corresponding to the line at the caret position. This item is disabled during program execution/build (not including rapid build) execution. |
|||
|
Sets the address of the line at the current caret position to the current PC value. This item is disabled during program execution/build (not including rapid build) execution. |
|||
|
Opens the Go to the Location dialog box to move the caret to the specified address. |
|||
|
Moves the caret to the define position of the selected symbol. |
|||
|
Moves the caret to the position (address) immediately before it is moved by [Go to Symbol]. Note that this item is disabled when no symbol name is displayed in the address. |
|||
|
The following cascade menus are displayed to set the break-related event. |
|||
|
Sets a breakpoint (Hardware Break event to the address at the caret position (see "2.9.3 Stop the program at the arbitrary position (breakpoint)"). |
|||
|
Sets a breakpoint (Software Break event) to the address at the caret position (see "2.9.3 Stop the program at the arbitrary position (breakpoint)"). |
|||
|
Sets a break event with read access condition to a variable at the caret or a selected variable (global variable/static variable inside functions/file-internal static variable)/I/O register (see "2.9.4 Stop the program at the arbitrary position (break event)"). |
|||
|
Sets a break event with write access condition to a variable at the caret or a selected variable (global variable/static variable inside functions/file-internal static variable)/I/O register (see "2.9.4 Stop the program at the arbitrary position (break event)"). |
|||
|
Sets a break event with read/write access condition to a variable at the caret or a selected variable (global variable/static variable inside functions/file-internal static variable)/I/O register (see "2.9.4 Stop the program at the arbitrary position (break event)"). |
|||
|
Opens the Property panel to set the break function. |
|||
|
The following cascade menus are displayed to set the trace-related event. |
|||
|
Sets a trace start event to start collecting the trace data when an instruction of an address at the caret position is executed (see "2.12.3 Collect execution history in a section")Note 1. |
|||
|
Sets a trace end event to stop collecting the trace data when an instruction of an address at the caret position is executed (see "2.12.3 Collect execution history in a section")Note 1. |
|||
|
Sets a Point Trace event to record the access value as the trace data when a variable at the caret or the selected variable (global variable, static variable inside functions, file-internal static variable) or I/O register is read accessed (see "2.12.4 Collect execution history only when the condition is met"). |
|||
|
Sets a Point Trace event to record the access value as the trace data when a variable at the caret or the selected variable (global variable, static variable inside functions, file-internal static variable) or I/O register is write accessed (see "2.12.4 Collect execution history only when the condition is met"). |
|||
|
Sets a Point Trace event to record the access value as the trace data when a variable at the caret or a selected variable (global variable/static variable inside functions/file-internal static variable)/I/O register is read/write accessed (see "2.12.4 Collect execution history only when the condition is met"). |
|||
|
Sets a trace start event to start collecting the trace data when a variable at the caret or the selected variable (global variable, static variable inside functions, file-internal static variable) /I/O register is read/ write accessed (see "2.12.3.1 Set a Trace event"). |
|||
|
Sets a trace end event to stop collecting the trace data when a variable at the caret or the selected variable (global variable, static variable inside functions, file-internal static variable) /I/O register is read/ write accessed (see "2.12.3.1 Set a Trace event"). |
|||
|
Opens the Trace panel and displays the acquired trace data. |
|||
|
Opens the Property panel to set the trace function. |
|||
|
The following cascade menus are displayed to set the timer-related event (see "2.13.2 Measure execution time in a section"). |
|||
|
Sets a timer start event to start measuring the execution time of the program when an instruction of an address at the caret position is executedNote 2. |
|||
|
Specify a channel (n: 1 to 8) in which a timer start event is set. |
|||
|
Sets a timer end event to stop measuring the execution time of the program when an instruction of an address at the caret position is executedNote 2. |
|||
|
Specify a channel (n: 1 to 8) in which a timer stop event is set. |
|||
|
Opens the Events panel and displays only timer-related events. |
|||
|
Performance Measurement Settings [Full-spec emulator] [E1/E20] |
The following cascade menus are displayed to set the performance measurement-related event. |
||
|
Sets a performance measurement start event to start measuring performance measurement when an instruction of an address at the caret position is executed. |
|||
|
Specify a channel n (n: 1 to 3) in which a performance measurement start event is set. |
|||
|
Sets a performance measurement end event to stop measuring performance measurement when an instruction of an address at the caret position is executed. |
|||
|
Specify a channel n (n: 1 to 3) in which a performance measurement end event is set. |
|||
|
Sets a performance measurement start event that causes performance measurement to start upon read access to the caret position or a selected variable (global variable, static variable inside a function, static variable inside a file) or I/O register. |
|||
|
Specify a channel n (n: 1 to 3) in which a performance measurement start event is set. |
|||
|
Sets a performance measurement end event that causes performance measurement to stop upon read access to the caret position or a selected variable (global variable, static variable inside a function, static variable inside a file) or I/O register. |
|||
|
Specify a channel n (n: 1 to 3) in which a performance measurement end event is set. |
|||
|
Sets a performance measurement start event that causes performance measurement to start upon write access to the caret position or a selected variable (global variable, static variable inside a function, static variable inside a file) or I/O register. |
|||
|
Specify a channel n (n: 1 to 3) in which a performance measurement start event is set. |
|||
|
Sets a performance measurement end event that causes performance measurement to stop upon write access to the caret position or a selected variable (global variable, static variable inside a function, static variable inside a file) or I/O register. |
|||
|
Specify a channel n (n: 1 to 3) in which a performance measurement end event is set. |
|||
|
Sets a performance measurement start event that causes performance measurement to start upon read/write access to the caret position or a selected variable (global variable, static variable inside a function, static variable inside a file) or I/O register. |
|||
|
Specify a channel n (n: 1 to 3) in which a performance measurement start event is set. |
|||
|
Sets a performance measurement end event that causes performance measurement to stop upon read/write access to the caret position or a selected variable (global variable, static variable inside a function, static variable inside a file) or I/O register. |
|||
|
Specify a channel n (n: 1 to 3) in which a performance measurement end event is set. |
|||
|
Opens the Events panel and displays only performance measurement-related events. |
|||
|
Clears all the coverage measurement results currently being stored in the debug tool. |
|||
|
Changes to the edit mode to edit the instruction of the line at the caret position (see "2.6.4 Perform line assembly"). |
|||
|
Changes to the edit mode to edit the code of the line at the caret position (see "2.6.4 Perform line assembly"). |
|||
|
The following cascade menus to set the display contents in the disassemble area are displayed. |
|||
|
Displays the offset value of the label. The offset value from the nearest label is displayed when a label is defined for the address. |
|||
|
Displays the address value in the format "symbol + offset value" (default). Note that when a symbol has been defined as the address value, only the symbol is displayed. |
|||
|
Displays the name of the register by its function name (default). |
|||
|
Opens the Scroll Range Settings dialog box to set the scroll range for this panel. |
|||
|
Toggles between the mixed display mode (default) and disassemble display mode, as the display mode of this panel (see "2.6.2.1 Change display mode"). |
|||
|
Opens the Editor panel and jumps to the source line corresponding to the address at the caret position in this panel. |
|||
|
Opens the Memory panel (Memory1) and jumps to the memory value corresponding to the address at the caret position in this panel. |
|||
[Simulator] |
[Simulator] |
|
The type of break that can be set by a one click operation of the mouse is set as a hardware breakpoint (this is reflected in the setting of the [First using type of breakpoint] property in the [Break] [Full-spec emulator][E1][E20] category on the Property panel). |
|
|
The type of break that can be set by a one click operation of the mouse is set as a software breakpoint (this is reflected in the setting of the [First using type of breakpoint] property in the [Break] [Full-spec emulator][E1][E20] category on the Property panel). |
 button from [View] on the toolbar.
  in the tool bar, or by moving the mouse wheel forward or backward while holding down the [Ctrl] key.
 ) which indicates that multiple events have been set is selected, all of the events that have been set are enabled.
  ) which indicates that multiple events have been set is selected, all of the events that have been set are disabled.
  ) which indicates that multiple events have been set is selected, all of the events that have been set are deleted.
  to
to  when the position of the current PC is invalid (e.g., in cases where the current target core for debugging differs from the one selected at the time the program was stopped).
 button (toggle) on the toolbar or removing the check for [Mixed Display] from the context menu (this option is checked by default).
  button on the toolbar or selecting [Show Offset] from the context menu.


 button.
  Show Offset
 Show Symbol
 Show Function Name
 Show Absolute Name