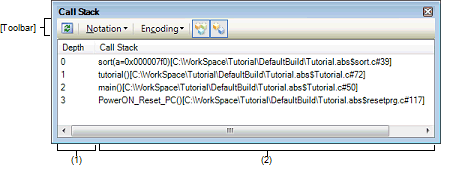
This panel displays call stack information for function calls (see “2.12.1 Display call stack information").
This panel can only be opened when CS+ is connected with the debug tool.
This panel is left blank while the program is in execution. |

Here, the following items are explained.
The callers of functions are assigned numbers in order starting from 1, with the line showing the current PC position assigned a 0.
Displays the current source position and call stack information about the calls placed on the stack (e.g., function caller position and parameters to each function).
The form in which information is displayed in this area differs depending on the status of which toolbar button,  or
or  , is selected, and which item from the context menu, [Show Parameter] or [Show Module File Name], is selected, as shown below.
|
<function>(<parameter>=<parameter valueNote>, ...)[<module file name>$<file name>#<line number>] (default) |
|
|
<function>(<parameter>=<parameter valueNote>, ...)[<file Name>#<line number>] |
|
An array of parameters are passed as a pointer, not as an array (C language specifications). Therefore, if parameters are comprised of an array, they are handled as pointer when displayed. |
This area has the following features:
Selecting [Jump to Source] from the context menu will open the Editor panel, with the caret moved to the source line from which the function at the current caret position is called. (The view will jump to the Editor panel if it is already open.)
Similarly, selecting [Jump to Disassemble] will open the Disassemble panel (Disassemble1), with the caret moved to the disassemble line indicating the address from which the function at the current caret position is called. (The view will jump to the Disassemble panel (Disassemble1) if it is already open.)
Selecting [Save Call Stack Data As ...] from the [File] menu will open the Save As dialog box in which you can save all contents of this panel to a text file (*.txt) or CSV file (*.csv).
For details on how to save call stack information, see "2.12.1.4 Saving the displayed contents of call stack information".
To zoom in and out of the Call Stack panel view, change the zoom ratio by using the drop-down list on the toolbar of the Main window while the focus is placed in the Call Stack panel.
You can also change the zoom ratio by using the [Ctrl] key + mouse-wheel combination.
Using the [Ctrl] key + mouse-wheel forward will zoom into the view, making the contents larger and easier to see (max. 300%). |
Using the [Ctrl] key + mouse-wheel backward will zoom out of the view, making the contents smaller (min. 50%). |
If the panel is closed after the zoom ratio is changed, the changed zoom ratio is retained (next time, the panel will open at the changed zoom ratio).
Each button in the toolbar are disabled during program execution.
[[File] Menu (Call Stack Panel-Only Items)]
The [File] menu used exclusively for the Call Stack panel is as follows. (The other items are shared.)
However, all of these items are disabled during program execution.
|
Saves the contents of this panel to a text file (*.txt) or CSV file (*.csv) that has been saved previously (see "(b) Saving the call stack information"). If this item is selected for the first time after startup, the same operation as [Save Call Stack Data As …] would have been selected is performed. |
|
|
Opens the Save As dialog box in order to save the contents of this panel to a specified text file (*.txt) or CSV file (*.csv) (see "(b) Saving the call stack information"). |
[[Edit] Menu (Call Stack Panel-Only Items)]
The [Edit] menu used exclusively for the Call Stack panel is as follows. (All other items are disabled.)
Each item on the context menu are disabled during program execution.
|
Copies the content of a selected line as character string to the clipboard. |
||
|
Adds a module file name to the line when it is displayed (default). |
||
|
Adds function call parameters to the line when it is displayed (default) |
||
|
Shows the following cascaded menu to specify the form in which values are displayed. |
||
|
Displays values on this panel in per-variable predetermined notation (default). |
||
|
Shows the following cascaded menu to specify character code. |
||
|
Opens the Disassemble panel (Disassemble1), with the caret on it moved to the address from which the function indicated by a selected line is called. |
||
|
Opens the Editor panel, with the caret on it moved to the source line from which the function indicated by a selected line is called. |
||
|
Opens the Local Variables panel that displays local variables for the function indicated by a selected line. |
||

 AutoSelect
 Hexadecimal
 Decimal
 Octal
Octal Binary
 ASCII
ASCII Shift_JIS
 EUC-JP
 UTF-8
UTF-8 UTF-16 Big-Endian
 UTF-16 Little-Endian
 UTF-32 Big-Endian
 UTF-32 Little-Endian
